In today’s fast-paced digital landscape, users expect applications to be fast, reliable, and seamless. As developers, we strive to meet these expectations, but how do we ensure that our applications perform optimally under the hood?
If you’ve ever struggled with understanding why your application’s response times spiked or where a request failed in a distributed system, you know how challenging it can be to pinpoint the root cause without proper tools. This is where OpenTelemetry comes in. OpenTelemetry is an open-source framework designed to collect, process, and export telemetry data (traces, metrics, and logs) from your application.
In this post, we’ll explore how to set up and use OpenTelemetry in a Java application, from basic instrumentation to exporting and visualizing data. By the end, you’ll have a clear roadmap to build robust monitoring into your applications and uncover performance bottlenecks before your users do.
So, ready to take your Java application monitoring to the next level? Let’s dive in!
The code for this post can be found: gjong/open-telemetry-demo
Bootstrapping the project
First we need to make sure that we have the needed dependencies in the project. To make the management of versions a bit easier include the bill-of-materials for OpenTelementry by adding the following:
 1<dependencyManagement>
 2    <dependencies>
 3		<!-- Ensure that all versions are compatible by importing the BOM -->
 4        <dependency>
 5            <groupId>io.opentelemetry</groupId>
 6            <artifactId>opentelemetry-bom</artifactId>
 7            <version>1.37.0</version>
 8            <type>pom</type>
 9            <scope>import</scope>
10        </dependency>
11	</dependencies>
12</dependencyManagement>
In this post we will be using the SDK to set everything up manually. So we need to include the following dependency.
1<dependency>
2    <groupId>io.opentelemetry</groupId>
3    <artifactId>opentelemetry-sdk</artifactId>
4</dependency>
5<dependency>
6    <groupId>io.opentelemetry</groupId>
7    <artifactId>opentelemetry-context</artifactId>
8</dependency>
To demo that everything works we will be reporting all the measurements using the Java logging system. To achieve that the following should also be included in the project.
1<dependency>
2    <groupId>io.opentelemetry</groupId>
3    <artifactId>opentelemetry-exporter-logging</artifactId>
4</dependency>
Initializing OpenTelementry
Using the SdkTracerProvider we can configure some properties that identify the application. This information is sent along to the exporters that you configure (in our case the logging exporter).
1var applicationResource = Resource.create(Attributes.of(
2            AttributeKey.stringKey("application.name"), "open-telemetry-demo",
3            AttributeKey.stringKey("application.version"), "1.0.0"));
4var tracerProvider = SdkTracerProvider.builder()
5		.setSampler(Sampler.alwaysOn())
6		.setResource(applicationResource)
7		.build();
Then we can create an instance of OpenTelemetry to be able to use it for measuring the time it takes to execute method calls or pieces of code.
1var openTelemetry = OpenTelemetrySdk.builder()
2		.setTracerProvider(tracerProvider)
3		.build()
4var tracer = openTelemetry.getTracer("open-telemetry-tracer");
Wrapping code you want to monitor
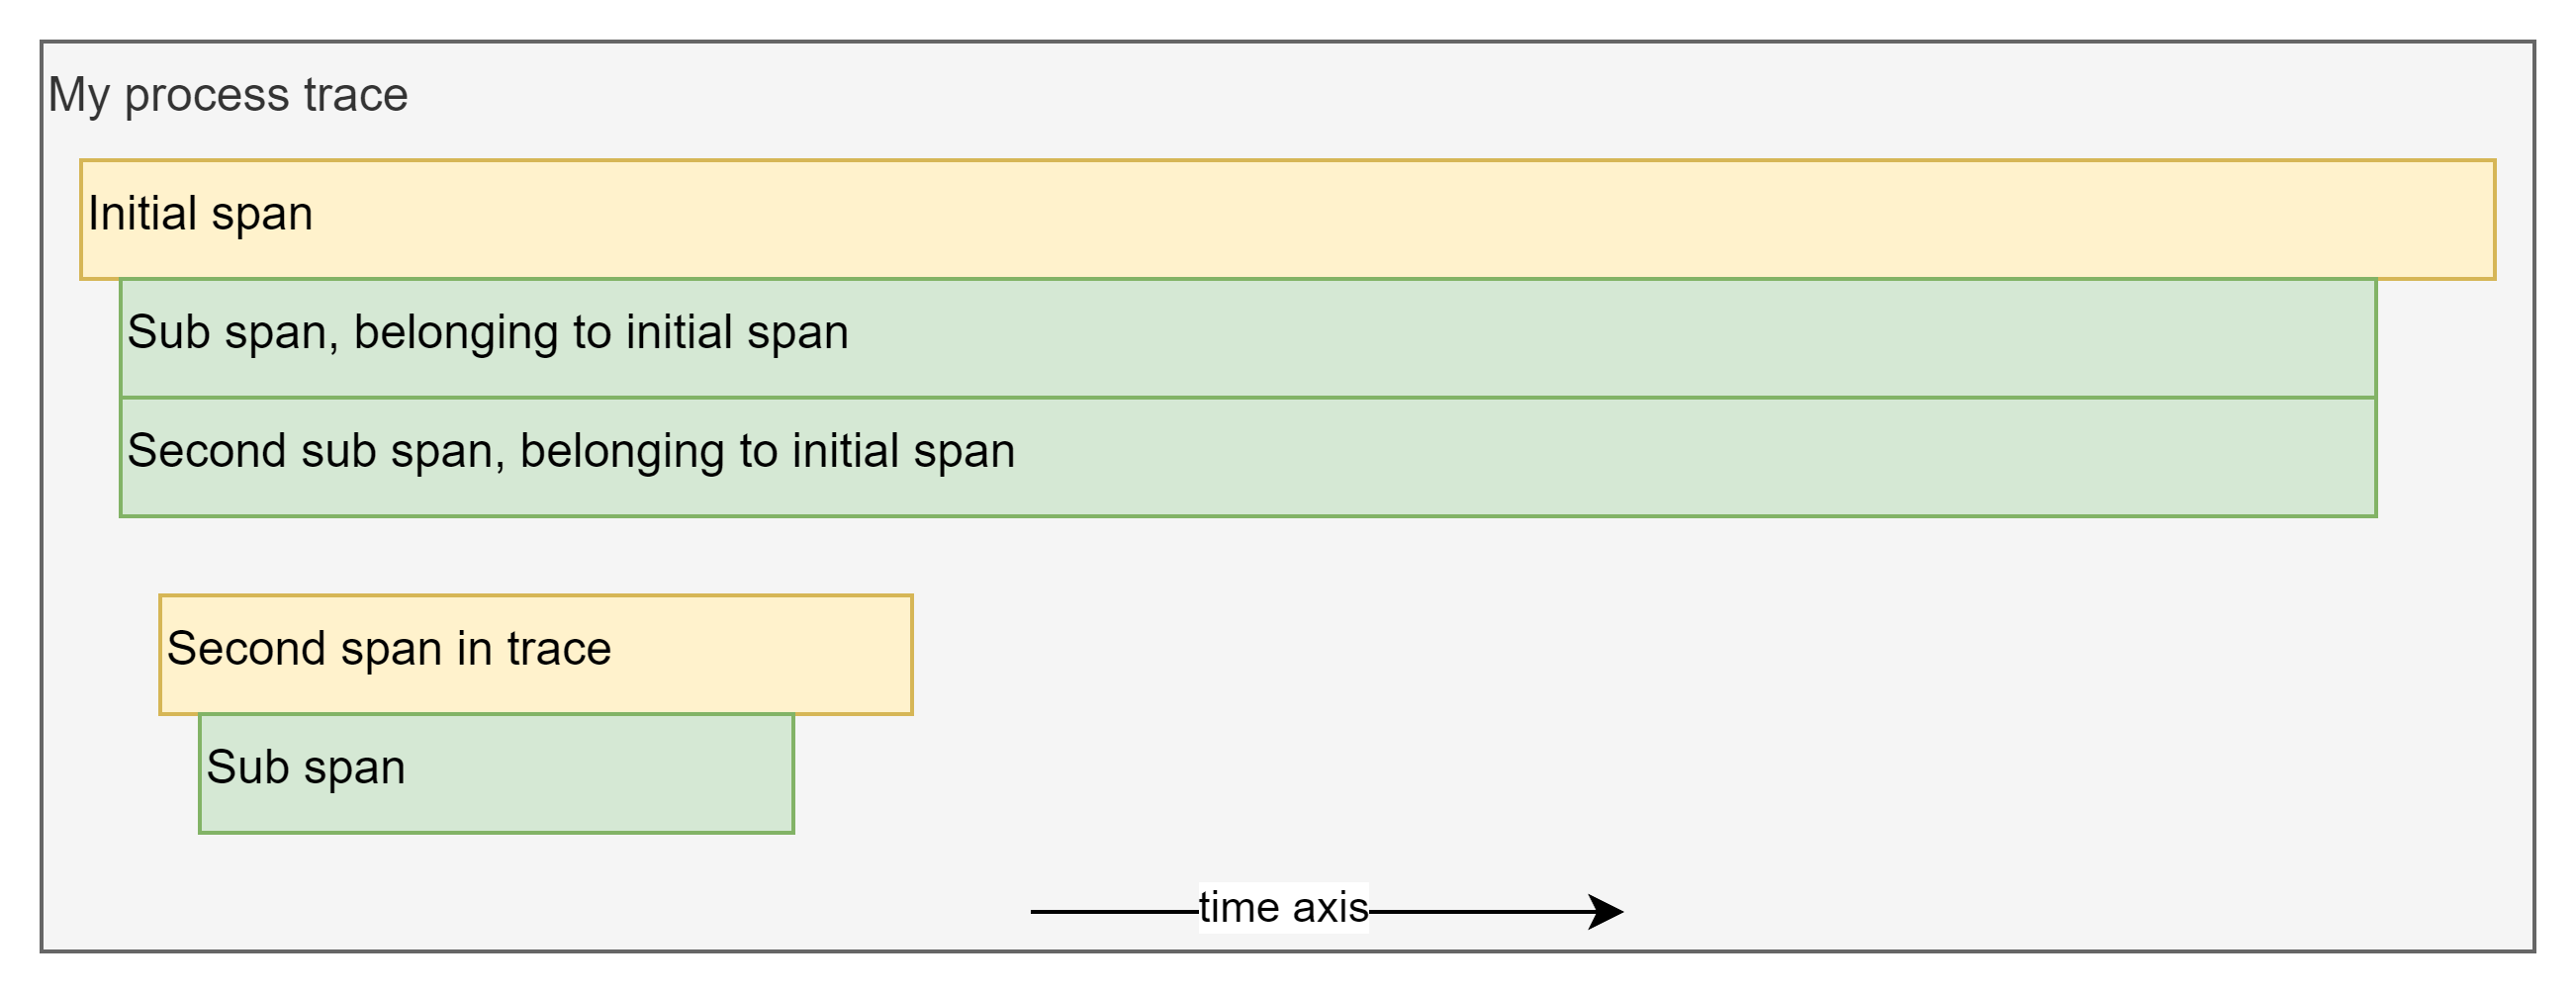
Of course we want to actually be able to monitor performance of the applications code. To do so we need to create some code that starts and stops spans. Essentially OpenTelemetry recognizes what is called traces, and each trace can have one or more spans in it. Each span can optionally have child spans. See the image below for a graphical representation of this concept.
Lets create a method that we can use to create these spans around our code. We can use the already created tracer to create a span using the spanBuilder() method. If we then call the startSpan() on the returned SpanBuilder instance.
This will provide us access to the Span instance we need to record timings and potential exceptions.
1private <R> R traceExecution(Supplier<R> wrappedCall, String name) {
2    var span = tracer.spanBuilder(name)
3            .setSpanKind(SpanKind.INTERNAL)
4            .startSpan();
5    // added a bit later
6}
Now using the span and the Supplier argument of the method traceExecution we can wrap that supplier and measure the time.
1 try (var x = span.makeCurrent()) {
2    return wrappedCall.get();
3} catch (Exception e) {
4    span.recordException(e);
5    span.setStatus(StatusCode.ERROR);
6    throw e;
7} finally {
8    span.end();
9}
In this code we catch all potential exceptions that are thrown in the supplier to register them with the span. That way any OpenTelemetry exporter will now that the trace contained failed calls and the reason of the failure.
Monitoring our code
With the created traceExecution method we can start monitoring our code base to detect how long specific pieces of code take to run.
1var number = traceExecution(this::doSomething, "sample-external-call");
2}
Given that the following method also exists in the same class.
 1int doSomething() {
 2    return traceExecution(() -> {
 3        doSomethingElse();
 4        return 5;
 5    }, "do-something-else");
 6}
 7
 8void doSomethingElse() {
 9    LOG.info("Doing something else");
10}
Logging the span and trace information
Utilizing the OpenTelemetry setup we can also add tracing information into the log of the application. This will help in troubleshooting as you can see all log messages that belong to the same execution.
A good example is starting a trace when a HTTP request comes in, logging this information in each message will help identify all log lines from a single API call. In this post we need to add the following dependencies to make this work.
 1<dependency>
 2    <groupId>ch.qos.logback</groupId>
 3    <artifactId>logback-classic</artifactId>
 4    <version>1.5.16</version>
 5</dependency>
 6<dependency>
 7    <groupId>org.slf4j</groupId>
 8    <artifactId>jul-to-slf4j</artifactId>
 9    <version>2.0.16</version>
10</dependency>
Then we can configure an updated logger to display the span and trace information using the logback.xml in the root of the resources.
 1<configuration>
 2
 3    <appender name="STDOUT" class="ch.qos.logback.core.ConsoleAppender">
 4        <withJansi>false</withJansi>
 5        <!-- encoders are assigned the type
 6             ch.qos.logback.classic.encoder.PatternLayoutEncoder by default -->
 7		<encoder>
 8            <pattern>%magenta(%d{YYYY-MM-DD}) %cyan(%d{HH:mm:ss.SSS}) [SpanId=%X{span_id},TraceId=%X{trace_id}] %highlight(%-5level) %gray([%thread])  %magenta(%logger{36}) - %msg%n</pattern>
 9        </encoder>
10	</appender>
11	<root level="info">
12	    <appender-ref ref="STDOUT" />
13	</root>
14</configuration>
This configuration makes the assumption that the trace_id and span_id are set in the diagnostic context of the logger. Which we have not yet done, so lets create a method to allow us to set this information for the active span.
 1void updateLogContext() {
 2    var span = Span.current();
 3    if (span.isRecording()) {
 4        var spanContext = span.getSpanContext();
 5        MDC.put("trace_id", spanContext.getTraceId());
 6        MDC.put("span_id", spanContext.getSpanId());
 7    } else {
 8        // clean MDC if the span stopped recording
 9        MDC.remove("trace_id");
10        MDC.remove("span_id");
11    }
12}
Now we should update the traceExecution method to actually call this method as follows:
 1<R> R traceExecution(Supplier<R> wrappedCall, String name) {
 2    // unchanged code
 3    try (var x = span.makeCurrent()) {
 4        updateLogContext();
 5        return wrappedCall.get();
 6    } catch (Exception e) {
 7        // unchanged code
 8    } finally {
 9        span.end();
10        updateLogContext();
11    }
12}
Conclusion
Effective monitoring and observability are essential for building reliable, high-performing applications, especially in today’s complex distributed systems. By leveraging OpenTelemetry in Java, you gain the ability to trace, measure, and understand the inner workings of your application, from individual operations to system-wide performance. The example above highlights how spans can provide rich telemetry data, enabling you to diagnose issues and optimize performance with precision.
As you integrate OpenTelemetry into your projects, remember to focus on meaningful instrumentation, export data to tools that provide actionable insights, and continuously refine your observability practices. With OpenTelemetry, you’re not just monitoring your application—you’re equipping your team with the visibility to innovate confidently and deliver exceptional user experiences.